Showing posts with label Microsoft News. Show all posts

Wednesday, January 6, 2021

Google Sheets vs. Microsoft Excel: Which works better for business?


 Google Sheets and Microsoft Excel are the two best-known spreadsheet applications available today. Both are polished and very useful — so much so that it’s easy to cling to the application you’re currently using without learning how the other has improved over the years. If you (or your business) chose one spreadsheet app and rejected the other years ago, there may be good reasons to reconsider.

To find out where Sheets and Excel stand today, both individually and compared to each other, I tested them by trying out the most common tasks users perform, including starting a new spreadsheet, inputting data and formulas, formatting cells, creating charts, adding extras such as data from external sources, and collaborating with others.

To test all that, I decided to create a typical spreadsheet that many business professionals might need to assemble: a budget tracker. I built one that tracked eight months of income and expenses for an imaginary company, including both results and projections.

Before I forget — there is one glaring difference between Sheets and Excel that should be mentioned: price. Although Google Sheets is part of Google’s licensed G Suite package for businesses, it remains free for individual use. Excel is available as part of Microsoft Office, which has a variety of different iterations for personal or business use and is available as either an annual Microsoft 365 or Office 365 subscription or as a one-time purchase (what Microsoft calls the “perpetual” version of Office). Individuals can use the online version of Excel for free, but its functionality isn’t as robust as the desktop client’s.

This review focuses on the Excel desktop application for Windows in Microsoft 365/Office 365. Individuals and businesses who use the perpetual version of Excel may not have all the features covered here. Because it’s a multiplatform world, I also tested Excel’s macOS desktop client, its web version, and its Android and iOS mobile apps. Google Sheets is web-based, so I used it in my Edge and Chrome browsers; Google also offers Sheets apps for Android and iOS, so I tested those as well.

Creating a spreadsheet

Perhaps what’s most important about a spreadsheet is how easy it is to create one, and then to input data and formulas. How the spreadsheet looks is important as well, especially if you use it to present data to others. So I began by looking for a usable, editable template I could turn to my purpose. Then I edited it, input the data, and added and tweaked formulas. If no suitable template was available, I started from scratch.

Google Sheets

If you’re looking for a great selection of templates, Google Sheets isn’t the place to go. I found a modest 28 templates — period. Considering that Excel has 79 templates for budgets alone, Google Sheets’ pickings are pretty slim.

Google had only a single business budget available, named “Annual business budget” and created by Intuit QuickBooks. At first glance, it looked ideal for my task. It has separate tabs for income, expenses and a summary. For each tab, I would only need to make edits to the categories. However, as I examined it, I realized it had no way of tracking estimated versus actual spending. And customizing the template was extremely difficult: There were so many internal links to formulas and calculations that tracking them down and editing them seemed almost impossible. So I finally abandoned the template and instead started from scratch.

It was an easy but time-consuming process. Formulas are available via Insert > Function, or they can be input by hand. For a full list of what’s available, there is a Google page titled Google Sheets function list. You can also get the list within Sheets via Insert > Function > All.

Google Sheets doesn’t offer as many tools for dressing up your spreadsheets as does Microsoft Excel. Excel has hundreds of fonts and font variants available; Google has 33. Excel has many pre-set ways of formatting cells with color, text headings and more; Google has only the most basic of tools. The end result: Google Sheets spreadsheets look basic and bare-bones.

Sheets does do a good job of importing spreadsheets from Excel. Simply upload the spreadsheet and open it in Sheets. In my admittedly straightforward spreadsheets, formulas, charts and formatting came through without problems, including from the Excel spreadsheet I created from a template for this story.

Microsoft Excel

When it comes to budget templates, Excel has an embarrassment of riches, whether it’s a business budget or a special-purpose budget, such as for a marketing event. There’s a good chance that you’ll find one that fits what you’re looking for and that can be easily edited.

When you create a new spreadsheet, you are presented with a list of 25 templates, including several for a variety of budgets. And that’s just a small selection of what’s available — you can also browse or search from within Excel through Microsoft’s collection of thousands of online templates. I searched using the term “budget” and found 79. When I clicked each template, I got more details, including its purpose, what it’s suited for and a snapshot of a sample spreadsheet.

When I found one perfect for my budget, I downloaded, saved and named it. And within a few minutes I had a well-designed spreadsheet, ready to go.

The template included not just budget categories, such as operating expenses, personnel expenses and income, but also sample data, working formulas and very nicely formatted headings and text, ideal for presentations.

Not that I could just start entering data. I had to do some editing first, because I wanted to create a month-by-month running report about each month’s estimated versus actual spending, and this template had only one month in it. And, of course, my categories for income and spending were different from the template’s.

It was easy enough to do by renaming some categories and deleting others. Especially useful was the fact that the formulas were intelligent enough to adjust themselves when I deleted a category. For example, when I deleted a category called Asset Sales from the Income section, Excel automatically deleted the Asset Sales section of the formula that calculated total income. I didn’t have to make manual adjustments to the formula. I also added data and formulas for a new section called Net Income that would subtract total operating expenses and personnel expenses from income — one that was important to me but surprisingly not in the template.

Even though the template’s headings and text were beautifully formatted, I tried changing them, just to check out Excel’s formatting capabilities. Excel shines here: The Home tab in the Ribbon offers great tools for formatting text by changing fonts and their attributes, as well as for adding colors to cells.

I then copied the first monthly budget I had created by clicking its tab, selecting Move or Copy from the screen that appeared (making sure to check the Create a copy box) and then clicking OK. I did this several times to make several copies, then renamed each new tab so it represented a month: January, February, March, April, May, June and July. Then I went into each tab and changed the data to fit the appropriate month.

Voila! With only a little effort, I had built a handsome-looking eight-month budget detailing expenses, income and net income, and comparing all of that to projections.

Creating a spreadsheet: Bottom line

Microsoft Excel is worlds ahead of Google Sheets when it comes to template selection and tools for cell and text formatting. If how a spreadsheet looks is important to you, the choice is clear: pick Microsoft Excel. With Google, you’ve got only the basics. However, for inserting formulas, there’s no real difference between the two.

Inserting charts

Since charts are one of the best ways to clarify the meaning of data, I created a variety of them for my test budget: Pie charts to show categories of income and spending, line charts to show income and other data over time, and bar charts to compare categories for a single month.

Both Sheets and Excel offer additional data-visualization features such as pivot tables, which help you find and display underlying relationships between data. But this article focuses on charts, the most widely used and accessible data visualization tool.

Google Sheets

Google Sheets doesn’t quite have Excel’s chart-making prowess, but it still does quite a good job. The easiest way to create a chart is to select your data, then select Insert > Chart from the menu at the top of the screen. Sheets takes its best guess as to what kind of chart you want to create, and inserts it. It also opens up the Chart editor in the right pane, so that you can change the chart type and customize and edit the chart.

I found that most of the time, Sheets took the right guess and created the kind of chart I wanted, although it had a tendency to default to bar charts too frequently, even when a pie chart was the better choice. Still, it guessed right often enough, which made creating charts a breeze.

The Chart editor’s Setup and Customize tabs across its top make it easy to change your chart type, and edit and customize the chart. On the Setup tab you can use the Chart type drop-down to select a different chart type. It’s helpful that each chart type has a small thumbnail next to it, so you can see the kind of chart you’ll create. However, the thumbnails don’t use the data you’ve highlighted to create your chart, so you can’t get a preview of how your chart will look when you choose any type. As you’ll see in the next section, Excel does this, and it makes choosing chart types much easier.

As for creating a chart without selecting data first, it’s simple to do. Insert your cursor into a cell that is part of or contiguous to a row or column of data, and Charts assumes you want to create a chart using the nearby data. It then acts as if you had selected the data yourself, and takes a guess at the chart type, and you create the chart just as if you had selected the data. The only time I had an issue with this is when I created charts in complex spreadsheets, because Sheets sometimes was confused about what data I wanted to use.

Once you’ve inserted the chart, Google Sheets lets you change and customize it by right-clicking inside to do things such as changing the legend, title, axes, chart type or color. But those basic edits don’t approach the wealth of Excel’s considerable layout and design options — for example, you can’t choose many different layouts, and you don’t get as many formatting options or color choices. You can also double-click the chart to bring up the Chart editor, where you can make even more changes, including changing the chart type, and using many more options to customize the way the chart looks.

Google Sheets does have a large selection of charts, including not only the common pie, line, bar, area and column charts, but more esoteric ones as well, like radar, waterfall and histogram. However, there’s no easy way to create a sparkline chart, which inserts very simple line, column or win/loss charts into a single spreadsheet cell. It’s not available from the Chart editor as a chart type. Instead, you’ll have to use complex syntax, like this: SPARKLINE(A1:A5, {"charttype","column"; "axis", true; "axiscolor", "red"}) It’s quite easy to create sparklines in Excel, just one more example of the way in which Excel has superior chart-making capabilities.

Microsoft Excel

Creating charts in Excel is simplicity itself. The fastest way is to highlight the data you want to chart, and from the Ribbon’s Insert tab choose Recommended Charts. Excel then shows you thumbnails of the types of charts that are most suitable for the data you’ve chosen. The thumbnails use the data you’ve highlighted, so you can see precisely how the chart will look. Scroll through the recommended charts, click the one you want to use, and it gets created. It’s that simple. I created half-a-dozen charts and found the recommendations were always on target.

You don’t have to stick with the recommendations, though. If you haven't found an appropriate chart type after you highlight the chart data and choose Insert > Recommended Charts, you can click on All Charts and scroll through Excel’s vast selection.

Excel has 17 different chart types, including more popular ones such as column, line, pie, bar and area; more complex ones such as radar, surface and histogram; and some that are known mainly to data professionals, like box & whisker. And many chart types have multiple subtypes — for example, among the bar charts you'll find clustered bar, stacked bar, etc., and each of those has two variations.

The upshot? It's highly unlikely that Excel won't offer the chart type you want to use. (For more information about some new chart types available in Excel, see our “Excel for Office 365 cheat sheet.”)

As with the recommended charts, the thumbnails in All Charts use your data, so you get a preview of the chart you’re going to create. You can also simply highlight your data, select the Insert tab, click the down arrow next to the chart type you want to create (pie, line, bar and so on), then choose the precise chart you want from the charts that display.

Note that you don’t have to highlight data before creating a chart. From the Ribbon’s Insert menu, you can choose a chart type you want to create, and after the chart is inserted into the spreadsheet using default data, you can right-click the chart and choose Select Data. From there, you select the data you want to include from your spreadsheet.

Once you’ve created a chart, you get countless options for editing and customizing it, or for changing the chart type. Right-click the chart to select different data for the chart, format the chart and add borders or fills, etc. Click the chart and then go to the Design tab and you get far more capabilities, such as choosing variants of the basic design or changing colors.

Excel also creates what are called Sparkline charts, which insert very simple line, column or win/loss charts into a single spreadsheet cell. Sparklines are great for quickly showing trends graphically in a compact way — in my instance, showing data such as net income and total expenses over time. To create a Sparkline, you click in the cell where you want to insert it, choose the type of Sparkline you want to create from the Insert menu, then select the data you want to chart.

In short, Excel is a superb chart-creator, mixing ease of use with almost infinite customization and the intelligence to help you choose the right chart for best presenting your information.

Charts: Bottom line

Excel wins here. Microsoft’s tool makes it easier and less confusing to create charts, and you have far more options for changing the design, layout and colors.

Adding extras

Sometimes you want more than just basic charts and data. You might want to dress your spreadsheet up with pictures, links to external data, special charts and more. So after I created my budget, I checked out Google Sheets and Excel and for the extras they offer. Here’s what I found.

Google Sheets

Google Sheets offers a superb extra that does a lot more than make a spreadsheet or report look prettier. Google Forms lets you easily create forms to get feedback on the data, the format or the presentation — in fact, on anything. Although Forms is available as a separate service from Google, you can use it to attach a form to a spreadsheet. As people respond to the form, their responses are recorded to the spreadsheet.

To start a form from within Sheets, you select Insert > Form, and you’re sent to a new page that lets you create a questionnaire using several formats, including multiple choice, checkboxes, freeform text entry and more. You can add graphics and videos, add the date and time, require that questions be answered or not, and so on.

Once the form is done, it doesn’t live in the spreadsheet itself. Instead, you send the form via email (you can either send a link or the form itself) to those you’re soliciting feedback from. They fill out the form, and the information is tabulated and the results charted on a page in your spreadsheet that only you have access to.

In addition to Google Forms, Sheets has a handful of ways to dress up the spreadsheet. You can insert images from your computer, your Google Drive, a camera attached to your computer, or the web.  Unlike Excel, however, Sheets has no image-editing tools.

There’s also a library of add-on tools (choose Add-ons > Get add-ons), but I found little there for dressing up spreadsheets.

Microsoft Excel

Excel has plenty of those extras for anyone looking to make their spreadsheet come alive, ranging from unique charts and graphs to photo tools, links to external data and more.

My budget report included a section about the sales staff’s monthly sales. I decided to try Excel’s “People Graph” (accessed via the Insert tab in the Ribbon), which lets you create charts using graphics and themes designed for data having to do with people. You access it via the Insert tab on the Ribbon I used it to create a bar graph showing how much in sales each member of the staff booked for a single month. The results are eye-popping visuals that can add oomph to any spreadsheet.To create a People Graph, go to the Ribbon’s Insert tab; in the Add-ins section, click the People Graph button, an icon of a person in front of horizontal lines. You’ll have to agree to install an add-in. After a moment or two, it launches. Click the Data button on the upper-right of the chart, fill in the title, and click Select your data. Then click Create, and the app inserts a vivid, somewhat customizable chart. A Settings button lets you change the layout, graphics, colors and so on.

Keep in mind, though, that the customizations are limited when compared to other Excel charts. Also, at first you may think you can’t move the graph after you create it. But if you fiddle around a bit, you’ll be able to do it — move your cursor to the edge until the cursor looks like a cross, and then move the graph.

Another add-in, Bing Maps, lets you layer data on top of a map. Like People Graph, it’s available directly on the Ribbon’s Insert tab; its button displays Bing’s stylized “b” logo. I wanted to use it to show how much income was generated for my business in a specific month, by location. It took me several tries using it to get it right. It’s best to first select the data you want to chart, and then click the Bing Maps button. Even then, though, I had to do some extra work to get it right.

The add-in only works if the first column has the location data. So I had to redo the data on the spreadsheet. Once I did, it correctly mapped the data, but not in a particularly useful way. It showed all the locations of my business as circles on a map, but nothing more. To see the sales figures, I had to click each individual circle. It would have been much more useful to have bars on each location, representing the sales at that location.

You move the Bing Maps chart the same way you move the People Graph.

There are plenty of other things Excel offers for dressing up reports, though. I wanted to add photos, so I chose Insert > Pictures, which lets you choose from pictures on your computer, online pictures, and stock images. Stock images has many free, high-quality images you can use, along with a search box for finding them easily. In addition to photos, you’ll find icons and other types of art.

Although the images are high-quality and there are many of them, you’ll get a much larger selection if you choose to find online pictures. When you do that, you’re sent to a screen that lets you search through Bing images.  I tried multiple searches to see what I could add. Whether it was oil wells, snakes, robots or anything else I tried, I found many usable images, all of which were tagged with the Creative Commons license for reuse. (You can also expand the search by looking for all images, not just those with a Creative Commons license.) You can also insert your own photos in the same way, by choosing Insert > Pictures and navigating to the image you want to use.

Whether you’re adding an online image or your own, inserting it in the spreadsheet is simple: Click it, then click Insert. You can also edit the image in multiple ways, including basic photo editing such as color correction and adding artistic effects, adding borders and more. To do that, click the photo, and a Picture Tools tab appears in the Ribbon with a variety of photo editing tools.

Next, I decided I wanted to insert stock quotes into the report that would update on a constant basis. That capability isn’t built directly into Excel, but is available for free with the Stock Connector add-in from the Microsoft Store. I tried it with a couple of stocks, and it updated every 15 minutes.

There are many other features you can add that are available from the Data tab, including live data from SQL databases, tables on the web, and other sources.

You can also use drawing tools, available from Insert > Smart Art. And you can insert icons (select Insert > Icons), as well shapes you can use for flowcharts and other purposes (select Insert > Shapes).

In short, if you’re looking to dress up spreadsheets and reports, Excel is a vast, useful universe – although you might find some extras more useful than others.

Extras: Bottom line

If you’re looking to gather feedback about your spreadsheet, Google wins this round by a mile. Google Forms is an exceptionally useful tool for quickly and easily gathering feedback. All the data collection is automatically done for you and tabulated on tabs on your worksheets.

For everything else, though, Excel far outshines Sheets. It has a better selection of images as well as excellent image editing tools, something Google lacks. Excel also has a number of other features that can add value to a spreadsheet, although some — such as Bing Maps — still need work.


Monday, January 4, 2021

Microsoft takes steps to scrub Flash from Windows


Although Adobe stopped serving updates for its Flash Player last month — and will disable the plug-in on Jan. 12 — Microsoft will be in charge of uninstalling the software from Windows PCs.

(Adobe has recommended that users remove Flash from their personal computers to "help secure your system since Adobe does not intend to issue Flash Player updates or security patches after the EOL Date.")

Users can, of course, manually uninstall Flash using the steps Adobe posted on its website.

But Microsoft has a plan to scrub Flash from all Windows 10 and Windows 8.1 PCs this year, a plan that doesn't rely on users taking action.

October 2020

Microsoft seeded "Update for Removal of Adobe Flash Player" to the Microsoft Update Catalog on Oct 26. The update, also identified as KB4577586, "permanently removes Adobe Flash Player as a component of the Windows OS devices."

Users can select the appropriate-to-their-OS version of KB4577586, then download and apply it to their PC. Microsoft noted that the update removes only the Flash Player installed by Windows. "If you installed Adobe Flash Player manually from another source, it will not be removed," Microsoft said in a support document.

Early 2021

Microsoft will offer KB4577586 as an optional download on the Windows Update and WSUS (Windows Server Update Services) platforms.

A few months later

Microsoft will change KB4577586 to recommended on Windows Update and WSUS. Depending on the settings of Windows Update, recommended updates may be automatically downloaded and installed.

Summer 2021

The "Update for Removal of Adobe Flash Player," aka KB4577586, will be included in the monthly "Cumulative Updates" and "Monthly Rollups" from this point forward. In other words, KB4577586 will be automatically installed and activated, permanently removing Flash Player from the system.

Macs with Flash

Mac users with Flash Player must manually uninstall the plug-in using the steps. Adobe outlined here.

Tuesday, December 29, 2020

Microsoft to shift SMBs' Office subscriptions to 'Microsoft 365' brand


Microsoft today announced name changes to the Office 365 subscription plans in the Business line, substituting "Microsoft 365" instead.

The Redmond, Wash. developer did not touch subscription plans aimed at enterprise, education and government.

Plan names will automatically change on April 21, Microsoft said in an online statement. Prices of the plans will not change.

  • Office 365 Business Essentials, the lowest-priced plan in the Business line, will become Microsoft 365 Business Basic.
  • Office 365 Business, the middling plan in the trio that provides the Office applications and OneDrive, but no other services, will become Microsoft 365 Apps.
  • Office 365 Business Premium, the most capable and most expensive subscription plan of the three, will become Microsoft 365 Business Standard.
Microsoft will change the moniker of Microsoft 365 Business to Microsoft 365 Business Premium to fit it into the Business line as the top-dollar $20 per-user per-month plan. That subscription adds security and management tools to Office 365 Business Standard, née Premium. (Currently, this is the lowest-priced plan in the Microsoft 365 line. After the name changes, though, it will fall somewhere in the middle.)

Finally, the orphan of Office 365, the Office 365 ProPlus deal, which like Office 365 Business limits the bits to the Office applications and OneDrive, will get the same Microsoft 365 Apps nameplate. (Microsoft said if it needed to differentiate the two, it would append "for business" and "for enterprise" on the offerings.)

Subscription label changes aside, everything will remain untouched. "There are no price or feature changes to plans at this time (emphasis added)," Microsoft said in a short Q&A embedded in the announcement.

"We want our products to reflect the range of features and benefits in the subscription," the company noted, again in the Q&A. Specifically, Microsoft pointed to past additions to Office 365 Business Essentials and Business Premium plans, notably the Teams collaboration, video conferencing and online meeting software, as justifying a step up in naming.

"Second, we're always looking for ways to simplify," the company continued. "This new approach to naming our products is designed to help you quickly find the plan you need and get back to your business."

Microsoft's second reason was the weaker of the two.

Ever since the 2017 introduction of Microsoft 365 as a subscription plan label, Microsoft has had an identity problem, with that line and the much older Office 365 crossing streams. Just what was Microsoft 365? How was it different -- better than, by price anyway -- from the original?

Initially, Microsoft 365 was an über-suite, an über-subscription, for it started with Office 365, then added more, most importantly a subscription to Windows 10. Microsoft 365, then, was Office 365 + Windows 10. (It was more, but those pieces were the most important.)

Microsoft could be applauded by bringing more of its subscriptions under the Microsoft 365 moniker - that's clearly the name that will rule all at some point - but the brand remains scatter-brained. Some subscriptions are for consumers, as Microsoft also today announced an Office 365-to-Microsoft 365 name change for its Personal and Home deals; others are for business but sans Windows 10; yet more are for enterprises wishing for the kitchen sink, Windows included.

That's not a brand, that's just a mob.

And a large swath of Microsoft's plans will remain, at least for now, tapped as Office 365, including all the enterprise-, education- and government-aimed subscriptions, ranging from Office 365 A1 to Office 365 E5. To crowd those plans under a Microsoft 365 umbrella will take some doing, as the company will have to figure out how to untangle the duplicate x3 and x5 suffixes.

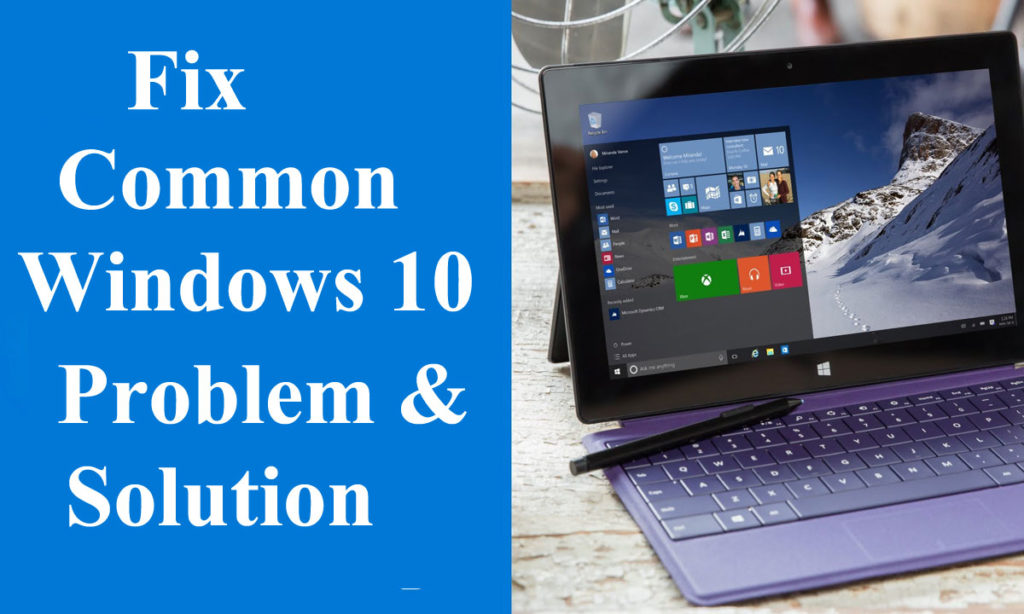
10 Common Windows 10 Issues and Solutions

 It has been almost 4 years since Windows 10 became available to the public user base, which was ready to be moved from Windows 8. But despite the reforms, some issues remained to be resolved.

windows 10 issues

Take a look at these 10 Windows 10 problems and solutions that any user can use to improve their time with this operating system.

Windows 10 problems and solutions

There are problems at all levels of an operating system, from installation to specific applications and processes. Some solutions may affect the way the operating system is running due to visual changes. If you take the time to change it, Windows 10 can be modified to meet some very specific requirements.

1. Installation

If you recall some time ago, Microsoft offered Windows 10 for free. Partly because many users became addicted to Windows 7 due to the changes made in Windows 8. Another reason was that some problems were on the way.

Before installing the operating system, there are a few things to check. The first is whether your current hard drive has enough space. However, the requirement of the previous two Windows operating systems is the same and almost none use such a small hard drive.

The second problem is the power of your system. Since Windows 7, many visual upgrades and background processes have been implemented. Don’t be surprised if your old Windows XP laptop can’t handle the upgrade.

2. Forced Updates

The forcing update was an idea with potentially good intentions. Some users, like the elderly, do not know that regular updates help secure their systems. Therefore Microsoft has forcibly applied the update.

Unfortunately, this also meant that some users were receiving updates at inconvenient times. Sometimes updates have made the computer unusable. It was so bad that people sued.

The user can now disable these updates as he did before:

  1. Open the start menu
  2. Type gpedit.msc in the search bar and choose the top option
  3. Follow the folder path: Computer Configuration \ Administrative Templates \ Windows Components \ Windows Update
  4. Configure and Configure Open Automatic Update Policy
  5. Select disabled
  6. Click apply
  7. Click OK

Be sure to update regularly when you have time via the Settings menu. Check for Settings / Updates and Security \ Windows Update \ Updates. Keeping up-to-date helps to keep your information secure.

3. Block Pop-ups in Edge

Nobody likes pop-ups while browsing. They can range from annoying pests to possible destruction of the system. Blocking these can also increase the loading speed of a website.

The default web browser for Windows 10 is Edge, which has a built-in pop-up blocker. It can be disabled by default but it is very easy to work with:

  1. Open edge
  2. Click three points on the top right
  3. Scroll until you get advanced settings
  4. Click block pop-up

Remember that some websites require pop-ups in your browser to function properly. To reactivate the popup window, simply repeat the steps and deactivate the blocker.

4. Create a System Restore Point

Another feature that is not enabled by default is that it allows you to restore your system to the state you were in when you set the restore point. If something goes wrong, you may want to set a restore point before a major update.

Activating it is quite simple:

  1. Open the Start menu and search for System Restore.
  2. Create a restore point and click to open the system properties panel
  3. Choose the System Protection tab
  4. Choose drive C: and click Configure
  5. Make sure the Enable System Security option is checked.
  6. Use the slider to choose between 5% and 10% of your hard drive to use for restore points.

5. I can not play DVD

By the time Windows 10 was released, most people had moved from DVD and other physical media to digital distribution. Since most computers do not come with a dedicated DVD player, the software allows your computer to read them. However, a better option is to download a free media player that can play DVDs instead of purchasing an external player or an expensive player.

6. Change the default application

Sometimes Windows 10 will try to open a new file type with the wrong application. Or, you have installed a separate application to open the files and need to change the default application. If Windows 10 does not know a new file type, it will ask you how you want it to run when you try to open it.

But if you want to change a default application before attempting to open a file type or if you need to change multiple default settings at once, you will need to use the settings:

  1. Open windows settings
  2. Click on default application then the application
  3. Choose the application you want to modify
  4. Select from the drop-down list

If you need to reset the default apps, you can always reset from the menu. If you run a company that makes apps and needs to know how to get people to choose your default, consider software QA.

7. Hide notifications

You’ll probably get tired of seeing them later, so you can also choose the ones you want to see now. Open the Settings menu again:

     In the Settings window, click System

     Click on Notifications and Actions

     Select the information you want to display.

8. Add or remove icons from the taskbar

You want your most-used apps available at all times and the best place to do this is right in the taskbar. You can open them with one click, even if you have another window open. But if there are too many icons, your taskbar will close quickly.

To remove an icon, simply right click on it and select Detach from the taskbar. To add an icon, open the app and right-click on its tab and choose Pin to taskbar.

9. Synchronization with other devices

If you have a Windows 10 computer, phone, and tablet, you can synchronize your information with all of them at once. Using your Microsoft account, you can configure all your devices to share bookmarks, applications, and settings so you don’t have to do it one by one. Just go to https://login.live.com/ and configure your sync settings, then log in on each device.

10. Stop Sharing

One of the biggest issues facing Windows 8, and now 10, is the amount of information they collect. If what you want to do for yourself, check the Privacy tab in your settings. Many people disable everything unless a specific application needs to access it.

Become an experienced user

These are just a few Windows 10 problems and solutions. Windows 10 offers many options and settings that will allow you to take ownership when you take the time.

See our other articles on how you can optimize your operating system.

Sunday, December 27, 2020

Word for Office 365 cheat sheet


Word has always been the workhorse app of the Microsoft Office suite. Nearly everyone who uses Office ends up using Word at some point, whether it be for writing memos, typing up agendas, creating reports, crafting business correspondence or any of a thousand other uses.

Microsoft sells Office under two models: Individuals and businesses can pay for the software license up front and own it forever (what the company calls the “perpetual” version of the suite), or they can purchase an Office 365 subscription, which means they have access to the software for only as long as they keep paying the subscription fee.

When you purchase a perpetual version of the suite — say, Office 2016 or Office 2019 — its applications will never get new features, whereas Office 365 apps are continually updated with new features. For more details, see “What are the differences between Microsoft Office 2019 and Office 365?”

This cheat sheet gets you up to speed on the features that have been introduced in Office 365’s Word for Windows desktop client since 2015. We’ll periodically update this story as new features roll out. (If you’re using the perpetual-license Word 2016 or 2019, see our separate Word 2016 and 2019 cheat sheet.)

Use the Ribbon

The Ribbon interface is alive and well in the current version of Word. Since it has been included in Office applications since Office 2007, you’re probably familiar with how it works.

In September 2018, Microsoft overhauled the way the Ribbon looks. It’s now flatter-looking, cleaner and less cluttered, and has high-contrast colors, which makes the icons and text on the Ribbon easier to see. The blue bar at the top has been reduced as well, with the tab names now appearing on a gray background. But it still works in the same way, and you’ll find most of the commands in the same locations as in earlier versions.

One minor change to the Ribbon layout is that there’s now a Help tab to the right of the View tab. And there are slight variations in the Ribbon’s appearance between editions of Word in Office 365. For instance, the Search box is located to the right of the Ribbon tabs in consumer editions but above the Ribbon tabs in enterprise editions.

To find out which commands live on which tabs on the Ribbon, download our Word for Office 365 Ribbon quick reference. Also note that you can use the search box on or above the Ribbon to find commands.

Just as in earlier versions of Word, to make the commands underneath the tabs on the Ribbon go away, press Ctrl-F1. (Note that the Ribbon tabs — File, Home, Insert and so on — stay visible.) To make the commands appear again, press Ctrl-F1.

You’ve got other options for displaying the Ribbon as well. To get to them, click the “Ribbon display options” icon at the top right of the screen, just to the left of the icons for minimizing and maximizing Word. A drop-down menu appears with these three options:

  • Auto-hide Ribbon: This hides the entire Ribbon, both the tabs and commands underneath them. To show the Ribbon again, click at the top of Word.
  • Show Tabs: This shows the tabs but hides the commands underneath them. It’s the same as pressing Ctrl-F1. To display the commands underneath the tabs when they’re hidden, press Ctrl-F1, click a tab, or click the Ribbon display icon and select “Show Tabs and Commands.”
  • Show Tabs and Commands: Selecting this shows both the tabs and commands.

And if for some reason that blue on the title bar is too much color for you, you can turn it white, dark gray or black. To do it, select File > Options > General. In the “Personalize your copy of Microsoft Office” section, click the down arrow next to Office Theme and select Dark Gray, Black, or White from the drop-down menu. To make the title bar blue again, choose the Colorful option from the drop-down list. Just above the Office Theme menu is an Office Background drop-down menu — here you can choose to display a pattern such as a circuit board or circles and stripes in the title bar.

There’s a useful feature in what Microsoft calls the backstage area that appears when you click File on the Ribbon: If you click Open, Save a Copy, or Save As from the menu on the left, you can see the cloud-based services you've connected to your Office account, such as SharePoint and OneDrive. Each location now displays its associated email address underneath it. This is quite helpful if you use a cloud service with more than one account, such as if you have one OneDrive account for personal use and another one for business. You'll be able to see at a glance which is which.

In the works: A simplified Ribbon

Microsoft is also working on a simplified version of the Ribbon for all Office applications. Like the existing Ribbon, it will have tabs across the top, and each tab will have commands on it. But it’s more streamlined and uses less space than the existing Ribbon.

For now, only Outlook for Windows uses the simplified Ribbon in Office 365. However, some users can get a preview of what it will look like in Word by going to the online version of Word. Use the slider next to Simplified Ribbon at the top right of the screen to toggle the simplified Ribbon on and off. If you don’t see the slider at the top of the screen, go to the Ribbon’s View tab and check the box next to Simplified Ribbon. To revert to the regular Ribbon, uncheck the box.

In the simplified Ribbon, all the commands are still there for each tab, but only the most commonly used are visible. Click the three-dot icon at the far right end of the Ribbon to show the rest of the commands in a drop-down menu.

In the Outlook desktop client, you can toggle between the streamlined and traditional Ribbon by clicking a small caret icon at the right edge of the Ribbon. We assume this will work the same way in Word, but at this point we have no details. We’ll update this section when the simplified Ribbon rolls out to Word for Windows.

Collaborate in real time

The biggest feature that’s been introduced in Word for Office 365 subscribers since 2015 is real-time collaboration. It lets people work on documents together from anywhere in the world with an internet connection, a feature that Google Docs has long had. Microsoft calls this “co-authoring.”

There are only three requirements for collaboration in Word for Office 365: You must be logged into your Microsoft or Office 365 account; the document must be stored in OneDrive, OneDrive for Business, or SharePoint Online; and AutoSave must be turned on.

To collaborate on a document, first open it, then click the Share icon in the upper-right part of the screen. If you haven’t yet saved your file in OneDrive, OneDrive for Business, or SharePoint Online, you’ll be prompted to do so. What happens next depends on whether your document is stored in your own OneDrive or with OneDrive for Business or SharePoint Online.

If your files are stored in your personal OneDrive, you’ll share documents via the Share pane. But if your files are stored in OneDrive for Business or SharePoint Online, you’ll use a newer interface that Microsoft rolled out to enterprise Office 365 users in May 2017. A Microsoft representative told us that the company intends to roll out the newer interface to consumers with an Office 365 subscription at some point, but it hasn’t announced timing yet. So we’ll give instructions for both interfaces below.

If your document is stored in your personal OneDrive: After you’ve saved the document to OneDrive and clicked the Share button, the Share pane will open on the right-hand side of the screen — this is command central for collaboration. At the top of the pane, type in the email addresses of the people with whom you want to collaborate on the document, separated by commas. As you type, Word looks through your address book and displays the matches it finds; click the person you want to invite. If you’re on a corporate network, you can click the address book on the right to search through your corporate email address book. If a person isn’t in your address book, just type in their complete email address.

ocument.

There’s another way to share a file stored in a personal OneDrive for collaboration: At the bottom of the Share pane, click “Get a sharing link,” and from the screen that appears, choose “Create an edit link” if you want to create a link to the file that will allow people to edit the file, or “Create a view-only link” if you want to create a link that will allow them to view the file only. Then copy the link, write an email using any email program, paste in the link, and send the email.

If you want to instead send the file but don’t want to let people collaborate on it, at the bottom of the Share pane click “Send as attachment.” You can then send the file either in Word format or else as a PDF. When you do this, it won’t reflect any changes you make to it after you send the file.

If your document is stored in SharePoint Online or OneDrive for Business: Clicking the Share button pops up a Send Link window. Here you can send an email with a link where others can access the document. 

By default, only the people whose email addresses you enter will be able to edit the document. If you like, you can click “People you specify can edit” to call up a “Link settings” screen, where you can expand access to anyone with the link, people in your organization with the link, or anyone who already has access to the file.

On this screen you can also uncheck the “Allow editing” box to set any of those permissions to read only. If you do that, you can optionally block people from downloading the file by toggling the “Block download” slider on. Finally, if you choose the “Anyone with the link” option, you can set an expiration date after which they won’t be able to access the file. When you’ve made your selections, click Apply.

Back in the main Send Link window, enter the recipients’ email addresses (as you type, Word will suggest people from your address book whom you can select), optionally type in a message, and click Send. An email is sent to all the recipients with a link they can click to open the document. Note that depending on how your IT department has set up permissions for users, you may not be able to send the invitation to people outside your organization.

(If you’d rather send recipients a copy of the workbook as an Excel file or a PDF, and thus not allow real-time collaboration, click Send a Copy at the bottom of the Send Link screen.)

To begin collaborating: When your recipients receive the email from you, they click a button or link to open the document, which opens in Word Online in a web browser rather than in the Word desktop client. Depending on a variety of factors, including whether recipients are signed into an Office 365 account, whether the file being shared is stored in a personal OneDrive or in OneDrive for Business/SharePoint, and whether the sender and recipient are from the same organization, recipients may or may not be able to start editing the document in their browser right away. Some users will have to click an Edit in Browser button first, and some will be able to choose between editing the doc in the browser or editing it in their desktop Word app.

The web version isn’t as fully featured as the client version — for instance, there aren’t as many formatting options and you can’t insert shapes, take screenshots, use mail merge, or use several other features. But for basic editing, it works fine.

When any collaborators open the document, you’ll see a colored cursor bar for each person that indicates their presence in the document. Each person gets their own unique color. Hover your cursor over anybody else’s cursor bar to see their name. Once they begin editing, you can see what each collaborator does as they do it, including deleting, editing and adding text. They see what you do as well.

Collaboration includes the ability to make comments at specific places in a document without actually changing the document’s contents. To do it, place your cursor in the document where you want the comment to appear (or select a word or phrase), click the Comments button in the upper right of the screen, and select New Comment. A new comment box appears in the right margin; type in your comment there. If you want to draw a colleague’s attention to a comment, @ mention them in the comment, they’ll receive an email notification with a link to the document.

Everyone collaborating can see all comments in the right margin. To reply to a comment, hover over it, click the Reply button, and type your response. There’s also a Resolve button that grays out the comment.

Be aware that how well real-time collaboration works depends on the strength of your internet connection. On slow or flaky connections, you won’t immediately see edits that other people make and they won’t see yours immediately — there will be a lag. So it’s always best, when possible, to have the strongest connection possible when collaborating.

If your document is stored in your personal OneDrive, the Share pane shows a list of all people currently collaborating on the workbook or who have been given access to it. If you don’t see the Share pane, click the Share button at the top of the screen to open it.

Double-click any name in the pane, and a screen appears that lets you communicate with them as you work. Email is always available, although that’s not particularly useful for simultaneous collaboration, since back-and-forth may take a while. Instant messaging and making voice calls using VoIP are available, but only via Skype and only if both of you are signed into Skype while you’re working on the document. Click the three-dot icon to the right of their email address, and you’ll be able to add the person to your address book, schedule a meeting with them, and add them to your favorites.

If the Share pane distracts you, click the X on its upper right and it goes away. To make it appear again, click the Share button at the top of the screen.

As noted previously, if your workbook is stored in SharePoint or OneDrive for Business, you won’t have a Share pane. But you can still see who has access to the file by clicking the Share button. In the Send Link screen that opens, click the three-dot icon in the upper right and select Manage Access to see a list of people who can access the file. Here you can change edit/view permissions, revoke someone’s access, or remove the sharing link altogether.

Search to get tasks done quickly

A very useful addition to Word 2016 was called Tell Me — basically, an enhanced search feature for finding commands in Word. Now renamed simply Search, it’s extremely helpful when you want to do a task that you haven’t done before or have forgotten how to do.

To use it, click in the Search box — for some Office 365 subscribers, it’s located on the Ribbon to the right of all the tab headers; for others, it’s above the Ribbon in the blue title area. (Keyboard fans can instead press Alt-Q to go to the Search box.) Type in a task, and you’ll get a list of possible matches. Click the task you want to get instructions on how to do it.

For example, I typed “address an envelope” and chose the “Envelope” result, and the screen you use for addressing envelopes appeared. When I typed in the more general query “write an essay,” it popped up a link to Word’s Researcher feature that lets you do research from right within Word, add sources from the research you find, and then cite the sources in the document properly. If you type in a query and hover your mouse over a result instead of clicking it, you’ll see a screen describing what you can do if you click the results.

It’s a big time-saver, because you don’t have to hunt through the Ribbon to find the command you want. And it remembers the features you've previously selected in the box, so when you click in it, you first see a list of previous tasks you've searched for. That way, tasks that you frequently perform are always within easy reach.

Search is gaining more capabilities, too. Some users of enterprise and education editions of Office 365 are now able to use the Search box to find people in their organization, SharePoint resources, and other personalized results from within Word. (These features are being rolled out in stages, so you might not have them yet.)

Adobe software list: Which apps do you need? Part 1

  The Adobe software list is long, as the Creative Cloud suite covers pretty much every creative need. Whether you're a graphic designer...

Most View